Sign up
or
Log in
Are.na
Gabrielle ☺︎
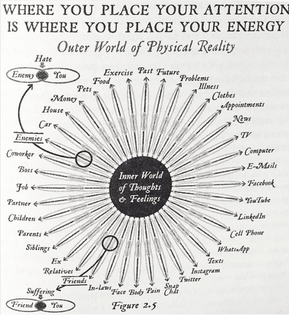
What’s your Data ⚡️
Info
—
40 Followers
This channel appears in
data narratives
,
connect and disconnect
,
string
,
Information Illustration (class)
,
*⃣ W⃣ e⃣ b⃣ .⃣ c⃣ o⃣ m⃣
,
𝔡𝔞𝔱𝔞 𝔳𝔦𝔰𝔲𝔞𝔩𝔦𝔰𝔞𝔱𝔦𝔬𝔫
,
DATA
,
about time!
,
data vizzo
,
Design / Data Vis
,
graficoz variadoz
,
design
,
time lines
,
time
,
23
,
Graphic — Swiss
,
Editorial — Diagram, Data Vis
, and
design_data vis
View
Grid
Table
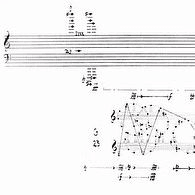
Fluxusgram on Instagram: ”“Solo for Pia…
screen-shot-2020-09-06-at-18.55.09.png
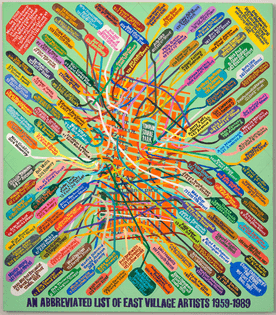
loren munk
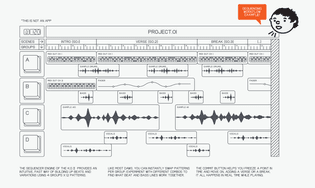
Teenage.Engineering - KO II.png
5colinforbesthink-metric_poster1968.jpg…
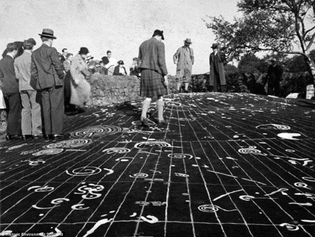
damaged-stone_0.jpg
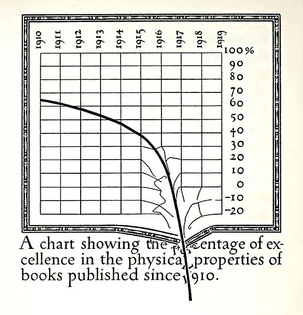
578px-Dwiggins_graph.jpg
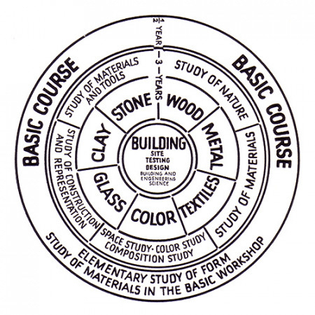
Bauhaus teaching diagram showing the pr…
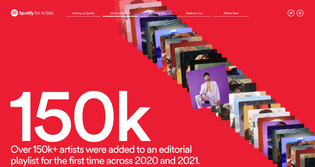
found.byspotify-2.png
jratqfw6njkxf7c2krkx.jpg
Join Are.na to follow
What’s your Data ⚡️
Sign up
Explore